
Opening — why the data lens matters
I’ve watched clinics buy gleaming devices and then wonder why outcomes drifted a year later; a steady hand at procurement soon learns that bench numbers don’t always match clinic floors. In a data-driven view, energy stability — measured as consistent fluence and pulse duration delivered to tissue — is the single most predictable factor linking equipment specs to patient results. That makes choosing and managing aesthetic medical equipment less about brand gloss and more about measurable performance over time. From my years advising dermatology teams in Boston and Phoenix, the difference between a dependable session and a baffling variation has always come down to how energy consistency was tracked and corrected.

What “energy consistency” really means
Energy consistency is the repeatability of output power (or fluence) and pulse characteristics (pulse duration, pulse-to-pulse variance) when the device is used under routine clinical conditions. For Q‑switched YAG and picosecond systems, that means the device should deliver near-identical energy across repeated pulses and across the first and last treatment of a day. Key industry terms to know here are fluence, pulse duration, and spot size — they directly affect efficacy and safety during tattoo removal, pigment work, and other resurfacing procedures.
How manufacturers calibrate — and where gaps appear
Manufacturers perform factory calibration using lab-grade power meters, integrating spheres, and traceable references. They test beam profile, measure energy at specific pulse widths, and certify tolerances. But labs are controlled environments: ambient temperature, cooling efficiency, and even mains voltage at the clinic alter performance. When a device ships it meets spec; later, thermal drift, Q‑switch timing shifts, or handpiece wear can change the delivered fluence. The lesson of the lab-to-clinic gap is simple: calibration is necessary but not sufficient unless it’s paired with field verification and schedule-based maintenance.
Practical, repeatable measurement techniques
Clinics can adopt straightforward tools and routines to spot drift early. Use a calibrated power meter or an integrating detector designed for pulsed lasers; place the sensor at the same spot size and distance as clinical use. Log energy (mJ) and pulse shape monthly, and compare trends rather than single readings. For Q‑switched units, monitor pulse-to-pulse variance and long-term energy decay; for picosecond systems, attention to pulse duration and peak power is equally important. Keep records tied to patient logs so you can correlate any unexpected outcomes with device performance.
Common failure modes and their signatures
Failures are rarely dramatic at first; they creep in. Typical signs include subtle loss of peak energy, increased pulse jitter, and inconsistent spot uniformity. You may see longer treatment times required to achieve the same clinical endpoint — or uneven clearance in multi-pass treatments. Sometimes it’s a cooling issue, sometimes optics contamination, and occasionally a misaligned Q‑switch timing circuit. Identify the signature early: falling fluence readings point to optics or diode wear; pulse shape changes hint at electronics or Q‑switch health.
Real-world anchor — a brief clinic case
In one clinic I advised in Boston, we logged monthly power readings and noticed a 12% fluence drop over six months on a Q‑switched YAG used heavily for tattoo removal. A quick inspection revealed degraded AR coatings on an internal mirror and a drifted power supply rail; replacement and recalibration restored levels and reduced adverse pigmentary responses. That audit reinforced a simple truth: routine verification prevents patient complications and saves money by catching small repairs before major failures.
Best practices for procurement and workflow integration
Procurement should require documented factory calibration methods and a field verification plan. Ask suppliers for baseline beam profile data and recommended verification intervals. Integrate a monthly energy-check station into your workflow — a short, scheduled QA check that takes under five minutes and uses the same handpiece and settings you employ on patients. Train staff to recognize when numbers fall outside acceptable tolerance bands, and keep spare consumables (handpieces, fuses, cooling filters) on hand to minimize downtime.
Common mistakes clinics make — and quick fixes
Clinics often assume “it’s the same machine” and skip regular checks — that’s the most expensive assumption. Another frequent error is using broad-brush acceptance criteria: a ±20% energy tolerance is too loose for many pigments and can cause inconsistent clearance. Also, some teams swap handpieces without retesting; different optics change spot size and energy density. Quick fixes: set tighter tolerance bands (±5–10% where possible), perform immediate checks after handpiece changes, and keep a simple log board by the device — visible accountability works wonders. —
Comparing measurement tools and service agreements
Power meters and integrating spheres are the two core options; meters are cheaper and convenient for spot checks, while spheres give a fuller picture for pulse energy and beam distribution. When evaluating service agreements, prioritize response time, included calibration checks, and whether the vendor provides traceable test reports. Consider third-party calibration versus manufacturer-only service; independent labs can offer unbiased baselines but may add logistics and cost. For clinics aiming at consistency, the best value often comes from a hybrid: manufacturer support for repairs and certified third-party checks for periodic verification.
Data-driven protocols to adopt
Implementing simple protocols turns calibration into a habit rather than a crisis response. Track three variables each month: peak energy (mJ), pulse-to-pulse variance (%), and beam profile uniformity. Use control charts to detect trends — not just single outliers. If any metric crosses a pre-set threshold, escalate: clean optics, run a service diagnostic, or schedule a field recal. These small steps let you act on data before complications accumulate.
Advisory close — three golden evaluation metrics
1) Energy Repeatability: Aim for ≤10% pulse-to-pulse variance and monthly fluence stability within ±5–10% of factory baseline. 2) Traceable Calibration Records: Require a written calibration certificate with date, instrument serial numbers, and measurement methodology. 3) Service Velocity & Scope: Prioritize vendors that guarantee same-week field checks or loaner devices and that include beam-profile testing in routine service.
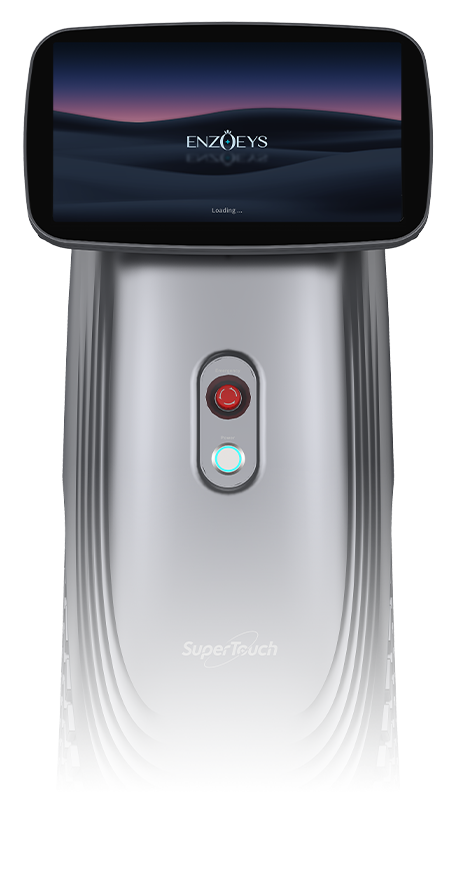
Follow these metrics and you’ll see fewer surprises in outcomes — clinics that adopt them protect patients and margins, and they make equipment performance a predictable input instead of a variable. ENZOEYS has the practical tools and verification workflows that fit neatly into this approach, giving clinics the bridge between manufacturer specs and clinic reality. I’ve seen it work repeatedly. One final thought: trust the numbers. They don’t forget.